LOADING DATA
Connecting...
Overview
Fastest Time (Men)Fastest ♂
Fastest Time (Women)Fastest ♀
Starters
Finishers
DNF Rate
Median Finish Time
Finish Times — All Participants
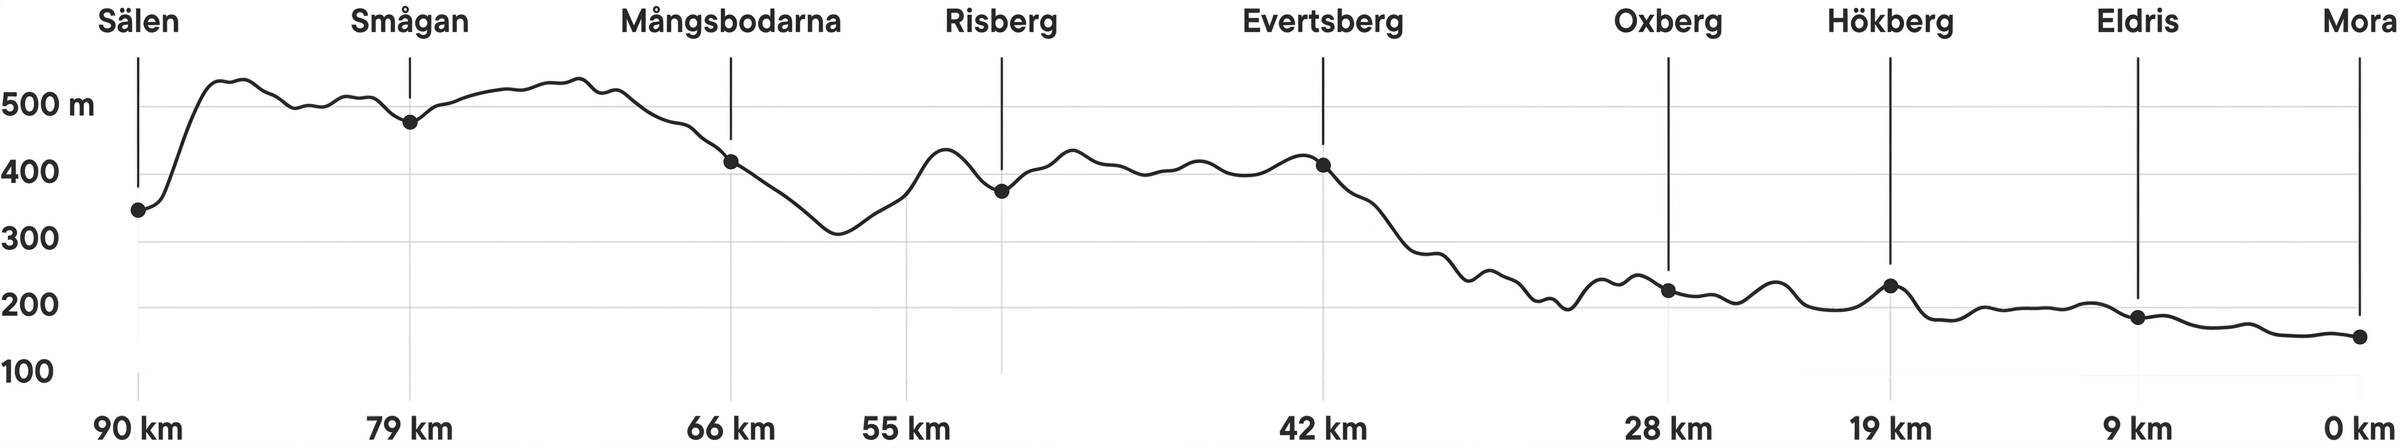
What Does It Take?
Nationality — Top 10
Race Participation Flow
Trends
Racers with Multiple Years
Biggest Time Range
Most Improved
Most Consistent
Multi-Year Racers
Start Groups
Moved Up
Keeps Group
Moved Down
Racers per Start Group
Avg Speed per Start Group
Times per Current Start Group
Start Group → Result Group Heatmap
Cell color intensity = number of racers (sqrt-normalized). Bold outline = kept same group.
Elapsed Times by Start Group
Elapsed times at each checkpoint for the selected start group and year.
Start Group Movement
| Place | Name | Class | Time | Current Group | Overall Place | Next Group | Change |
|---|
Results Table
Full Results
Compare
Select participants to compare (2-5)
Elapsed Time per Checkpoint
Speed per Segment (km/h)
Placement per Checkpoint
Time Gap (within comparison)
Time difference vs fastest compared racer at each checkpoint
Individual
DNF
DNF Count
Most Common Dropout
DNF by Gender
Dropouts per Checkpoint
DNF by Start Group
Early Speed: DNF vs Finishers
Distance Covered by DNF Participants
All DNF Participants
| Name | Class | Start Group | Last Checkpoint | Distance | Time at Last CP |
|---|
Race Dynamics
Biggest Climber
Biggest Faller
Most Volatile
Biggest Movers
Placement change from first checkpoint to finish
Where Positions Are Lost
Avg placement change per segment. Positive = gaining positions, negative = losing.
Pacing Profiles
Classified by placement trend: first half vs second half
Pacing by Finish Time
Pacing profile distribution across finish time groups
Top Movers Table
| Name | Class | HP | Finish | Change | Pacing | Finish Time |
|---|
Compare Years
Finish Time Distribution (15-min bins)
Box Plot (P10–P90)
Key Metrics Over Years
Percentile Curves
Age Groups
Participants
Avg Finish Time
Fastest
Finish Time Distribution by Class
Avg Speed by Class
Class Size
Median Finish Time by Class
Speed per Segment — Class Comparison
Class Leaderboard
Seeding
What is this? Estimate which Vasaloppet start group a qualifying race result corresponds to. Select a known race for exact cutoffs, or enter a custom race and the model will predict cutoff times based on distance, elevation and winner speed. You can also use this to estimate what time you need in an upcoming race to reach a specific start group.
Estimates based on historical seeding data from ~76 races. Vasaloppet sets cutoffs manually after each race — actual placement may differ. The range column shows expected model accuracy.
Race Setup
Your Result
Veterans
Most Races
Avg Races per Finisher
Veterans (30+ medal years)
Avg Finish Time by Experience
Avg Speed by Experience
Experience Distribution
DNF Rate by Experience
Most Vasalopp — Leaderboard
| # | Name | Races | Medal Years | Best Time | Latest | Class |
|---|
Pacing
Pacing Calculator
Enter a target finish time to see recommended checkpoint splits based on historical data from similar finishers.
Race Planner
Race Planner
Select your start group to see expected checkpoint times and cutoff margins based on historical data across all years.